alb5568325
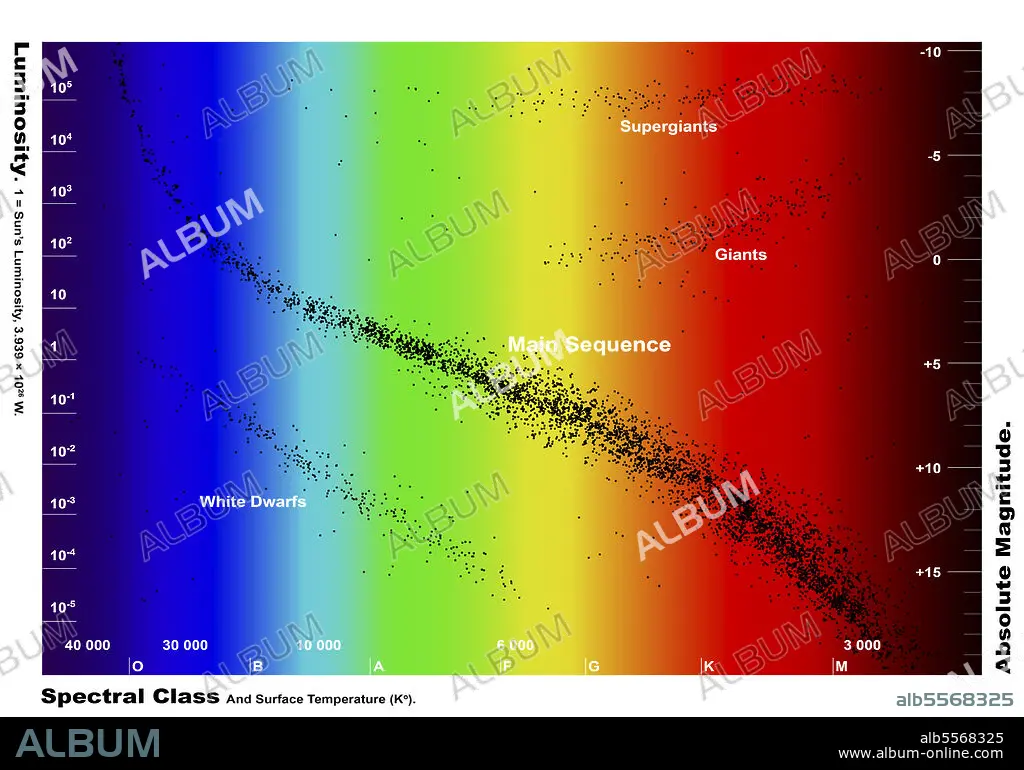
Diagram showing the spectral class and luminosity of stars.
| Teilen |
|---|
 Pinterest Pinterest |
 Twitter Twitter |
 Facebook Facebook |
 Link kopieren Link kopieren |
 Email Email |
|
Zu einem anderen Lightbox hinzufügen |
|
Zu einem anderen Lightbox hinzufügen |


Haben Sie bereits ein Konto? Anmelden
Sie haben kein Konto? Registrieren
Dieses Bild kaufen

Titel:
Diagram showing the spectral class and luminosity of stars.
Untertitel:
Siehe automatische Übersetzung
Diagram showing the spectral class and luminosity of stars. The diagram was named The Hertzsprung-Russell Diagram, or the H-R diagram for short. At the beginning of the 20th century two astronomers found that if stars were plotted on a diagram with their luminosity (brightness) on one axis, and their spectral class on the other, that stars formed three distinct groups. The largest group, the Main Sequence Stars, is where 90% of the stars are found. These stars are fusing hydrogen into helium in their cores. This group propagates diagonally from the upper left corner, down to the right corner. The group below the main sequence is the White Dwarfs, which is a group of small, earth-sized stellar remnants. The third group, which is found above the main sequence is that of the giants. Stars appear on a specific place on the main sequence depending on their mass and age. The mass determines when it will leave the main sequence.The H-R diagram is a significant tool for astronomers, when it comes to understanding stellar evolution.
Persönlichkeiten:
Bildnachweis:
Album / Fahad Sulehria/Stocktrek Images
Freigaben (Releases):
Model: Nein - Eigentum: Nein
Rechtefragen?
Rechtefragen?
Bildgröße:
5000 x 3500 px | 50.1 MB
Druckgröße:
42.3 x 29.6 cm | 16.7 x 11.7 in (300 dpi)
Schlüsselwörter:
ASTROPHYSIK • BLAU • DIAGRAMM • EVOLUTION • ILLUSTRATION • ILLUSTRATIONS • KARTE • MASS • REPRESENTATION • SPEKTRUM • TEMPERATUR • WASSERSTOFF • WELTRAUM
