alb9202196
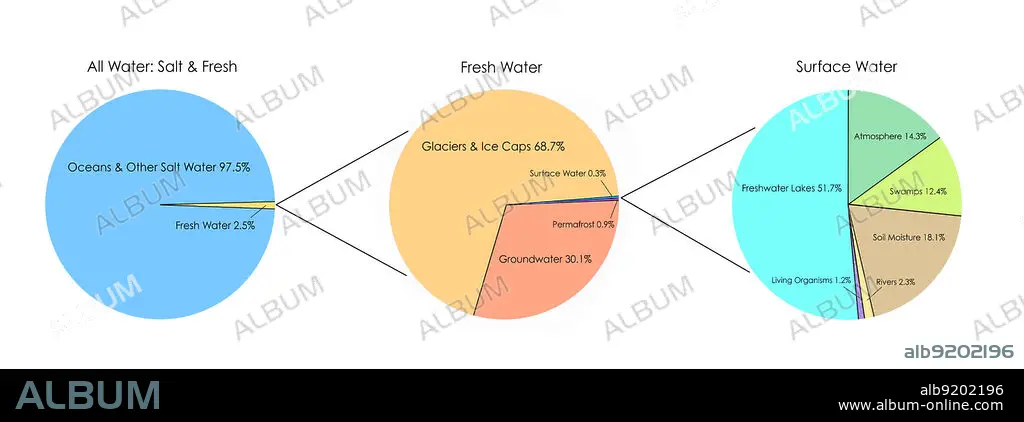
Earth's Water Sources, Infographic
| Share |
|---|
 Pinterest Pinterest |
 Twitter Twitter |
 Facebook Facebook |
 Copy link Copy link |
 Email Email |
|
Add to another lightbox |
|
Add to another lightbox |


Buy this image.
Select the use:

Title: Earth's Water Sources, Infographic
Caption: A series of pie charts showing (1) the relative amounts of salt water (97.5%) and fresh water (2.5%) on Earth; (2) the sources of Earth's 2.5% of fresh water (most of which are frozen and inaccessible); and (3) the sources of surface water (comprising only 0.3% of fresh water) from which we get most of the water we use.
Credit: Album / Jessica Wilson / Science Source
Releases: ? Model Release: No - ? Property Release: No
Rights questions?
Rights questions?
Image size: 9000 × 3240 px | 83.4 MB
Print size: 76.2 × 27.4 cm | 3543.3 × 1275.6 in (300 dpi)
Keywords: AMOUNTS • CHART • COMPARE • CONSERVATION • EARTH'S • EARTH • ENVIRONMENT • FRESH WATER • FRESH • FRESHWATER • GEOLOGIA • GEOLOGY • GLOBAL • INFOGRAPHIC • LABELED • NATURAL • ON • PERCENTAGES • PIE • RATIO • RESOURCE • SALT WATER • SALT • SALTWATER • SCARCITY • SOURCES • SURFACE • WATER
