alb3830609
Keeling Curve, Carbon Dioxide Scale
| Share |
|---|
 Pinterest Pinterest |
 Twitter Twitter |
 Facebook Facebook |
 Copy link Copy link |
 Email Email |
|
Add to another lightbox |
|
Add to another lightbox |


Buy this image.
Select the use:

Title: Keeling Curve, Carbon Dioxide Scale
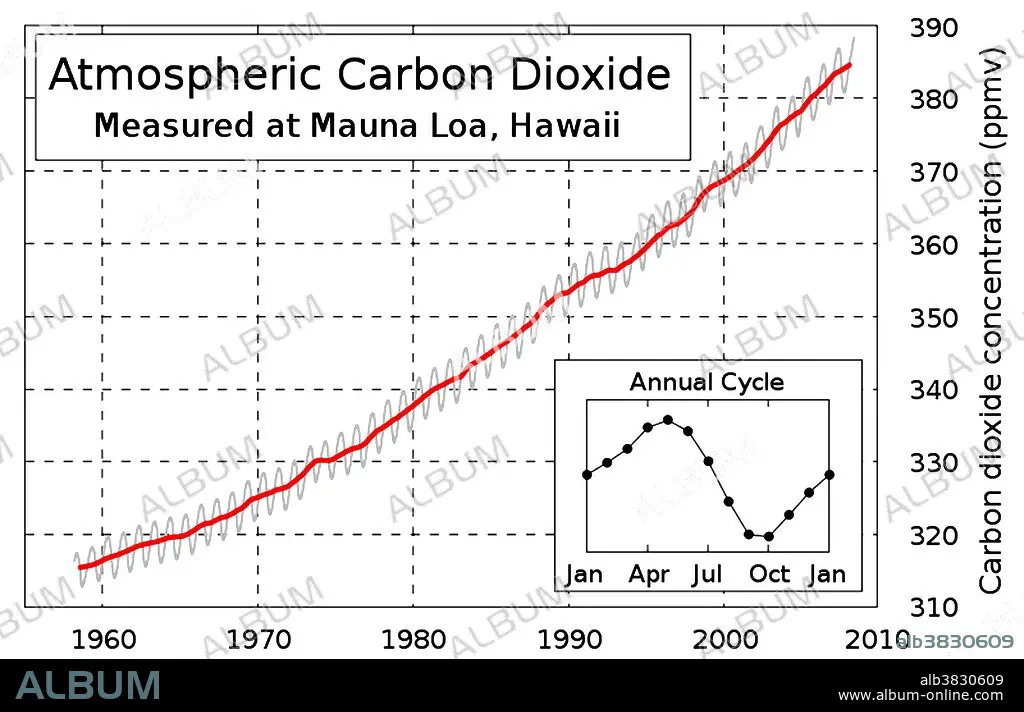
Caption: The carbon dioxide curve continues marching in an upward direction as shown by the observations of the Mauna Loa Observatory. The Keeling Curve is a graph which plots the ongoing change in concentration of carbon dioxide in Earth's atmosphere since 1958. It is based on continuous measurements taken at the Mauna Loa Observatory in Hawaii under the supervision of Charles David Keeling. Keeling's measurements showed the first significant evidence of rapidly increasing carbon dioxide levels in the atmosphere. Many scientists credit Keeling's graph with first bringing the world's attention to the current increase of carbon dioxide in the atmosphere.
Category: WEATHER
Credit: Album / Science Source / NOAA
Releases: ? Model Release: No - ? Property Release: No
Rights questions?
Rights questions?
Image size: 3900 × 2511 px | 28.0 MB
Print size: 33.0 × 21.3 cm | 1535.4 × 988.6 in (300 dpi)
Keywords: 1958 • 2010 • 21ST CENTURY • 21ST • 21TH CENTURY • AMERICA • AMERICAN • ART • ARTWORK • ASTRONOMY: OBSERVATORY • ATMOSPHERIC CONDITIONS • ATMOSPHERIC • CARBON DIOXIDE SCALE • CARBON DIOXIDE • CARBONIC ACID • CHANGE • CHART • DIAGRAM • DRAWING • EARTH'S ATMOSPHERE • EVIDENCE • HAWAII • ILLUSTRATION • ILLUSTRATIONS • ILUSTRATION • INCREASE • KEELING CURVE • LEVELS • MAUNA LOA • MEASURE • MEASUREMENT • MEASURING • METEOROLOGICAL • METEOROLOGY • METEOROLOGY • NATIONAL WEATHER SERVICE • NWS • OBSERVATORY • ORRERY • PLANETARIUM • PLANETARY • PLOT • PROOF • SCIENCE • UNITED STATES • US • USA • WEA • WEATHER EVENT • WEATHER • WEATHER: WEA
