alb9204350
Salt Water vs. Fresh Water, Infographic
| Share |
|---|
 Pinterest Pinterest |
 Twitter Twitter |
 Facebook Facebook |
 Copy link Copy link |
 Email Email |
|
Add to another lightbox |
|
Add to another lightbox |


Buy this image.
Select the use:

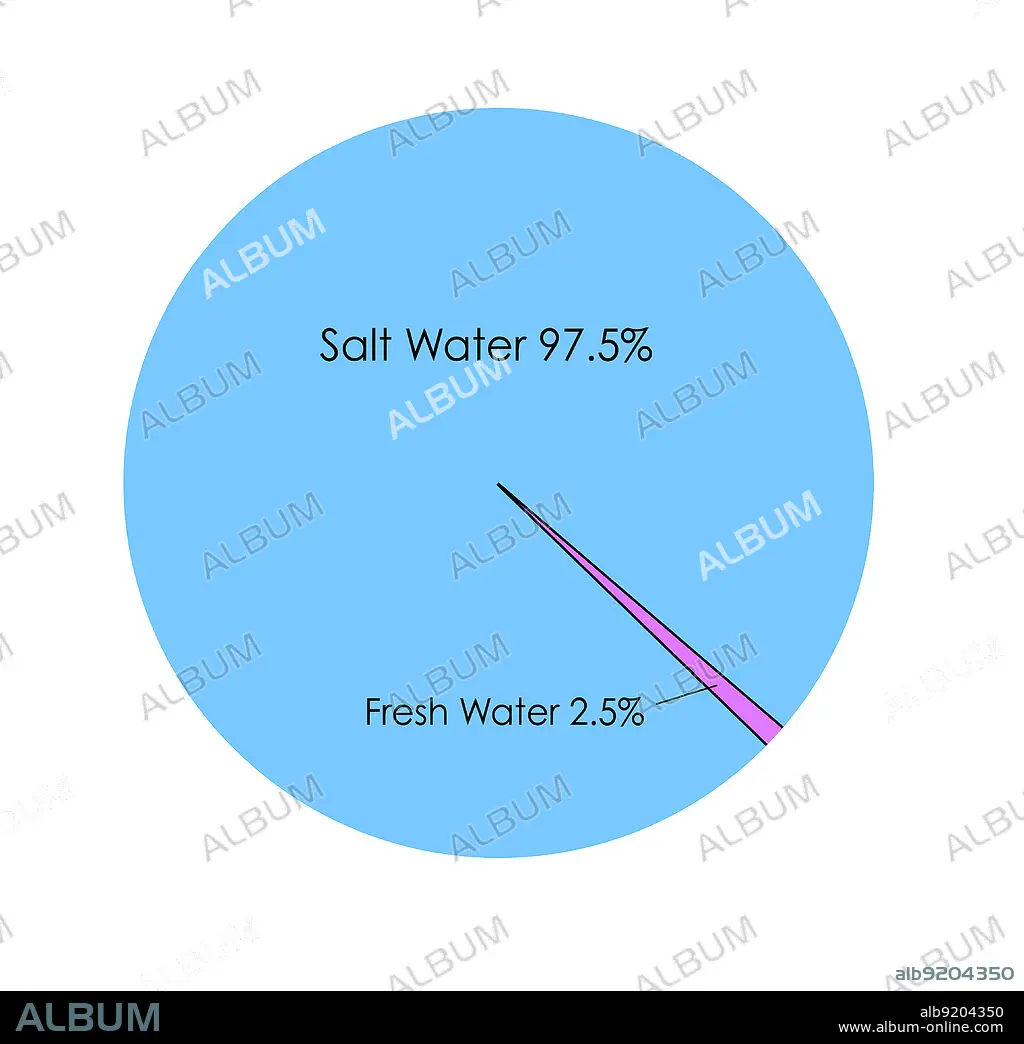
Title: Salt Water vs. Fresh Water, Infographic
Caption: A pie chart showing the percentages of salt water and fresh water on Earth. Salt water (oceans and saltwater lakes) accounts for 97.5% of all global water.
Credit: Album / Jessica Wilson / Science Source
Releases: ? Model Release: No - ? Property Release: No
Rights questions?
Rights questions?
Image size: 4592 × 4446 px | 58.4 MB
Print size: 38.9 × 37.6 cm | 1807.9 × 1750.4 in (300 dpi)
Keywords: AMOUNTS • CHART • COMPARE • CONSERVATION • EARTH • ENVIRONMENT • FRESH WATER • FRESH • FRESHWATER • GEOLOGIA • GEOLOGY • GLOBAL • INFOGRAPHIC • LABELED • NATURAL • ON • PERCENTAGES • PIE • RATIO • RESOURCE • SALT WATER • SALT • SALTWATER • SCARCITY • SOURCES • SURFACE • VS • WATER
