alb5412026
Charles Booth, London Poverty Map,1889
| Compartir |
|---|
 Pinterest Pinterest |
 Twitter Twitter |
 Facebook Facebook |
 Copiar enlace Copiar enlace |
 Email Email |
|
Añadir a otro lightbox |
|
Añadir a otro lightbox |


¿Ya tienes cuenta? Iniciar sesión
¿No tienes cuenta? Regístrate
Compra esta imagen.
Selecciona el uso:

Título:
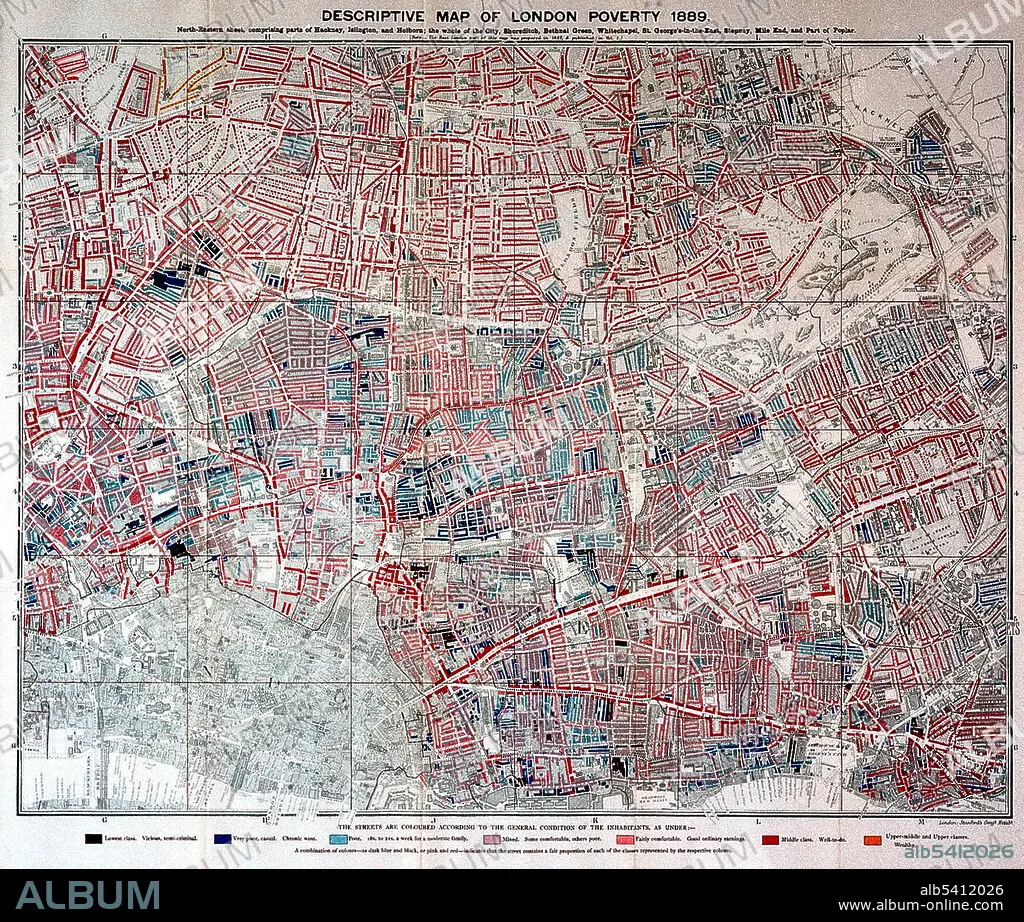
Charles Booth, London Poverty Map,1889
Descripción:
Ver traducción automática
Descriptive map of London poverty, 1889 (north-eastern sheet). Color code: black (lowest class), dark blue (very poor), light blue (poor), mauve (mixed), light orange (fairly comfortable), red (middle class, orange (wealthy). A poverty map is a map which provides a detailed description of the spatial distribution of poverty and inequality within a country. It combines individual and household (micro) survey data and population (macro) census data with the objective of estimating welfare indicators for specific geographic area as small as village or hamlet. Charles James Booth (March 30, 1840 - November 24, 1916) was an English social researcher and reformer. Booth investigated poverty in London, working with a team of investigators. This research, which looked at incidences of pauperism in the East End of London, showed that 35% were living in abject poverty. This work was published under the title Life and Labour of the People in 1889. A second volume, entitled Labour and Life of the People, covering the rest of London, appeared in 1891.
Personas:
Crédito:
Album / Science Source / Wellcome Images
Autorizaciones:
Tamaño imagen:
4050 x 3438 px | 39.8 MB
Tamaño impresión:
34.3 x 29.1 cm | 13.5 x 11.5 in (300 dpi)
Palabras clave:
1889 • CASETA DE TIRO AL BLANCO • CHARLES BOOTH • CIENCIAS SOCIALES • DÉCADA DE 1880 • DESIGUALDAD • FAMOSA • FAMOSO • HABITANTES • HISTORIA • INGLATERRA • INGLES • LONDRES • MAPA • POBREZA • SIGLO XIX
