alb3830609
Keeling Curve, Carbon Dioxide Scale
| Compartir |
|---|
 Pinterest Pinterest |
 Twitter Twitter |
 Facebook Facebook |
 Copiar enlace Copiar enlace |
 Email Email |
|
Añadir a otro lightbox |
|
Añadir a otro lightbox |


¿Ya tienes cuenta? Iniciar sesión
¿No tienes cuenta? Regístrate
Compra esta imagen.
Selecciona el uso:

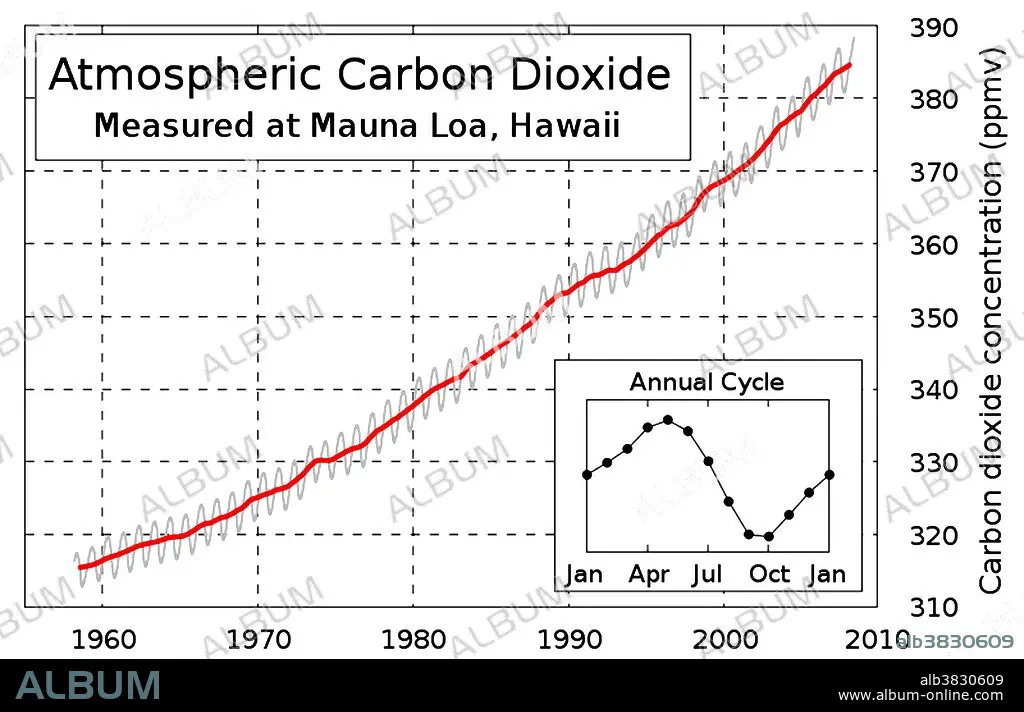
Título: Keeling Curve, Carbon Dioxide Scale
Descripción: Ver traducción automática
The carbon dioxide curve continues marching in an upward direction as shown by the observations of the Mauna Loa Observatory. The Keeling Curve is a graph which plots the ongoing change in concentration of carbon dioxide in Earth's atmosphere since 1958. It is based on continuous measurements taken at the Mauna Loa Observatory in Hawaii under the supervision of Charles David Keeling. Keeling's measurements showed the first significant evidence of rapidly increasing carbon dioxide levels in the atmosphere. Many scientists credit Keeling's graph with first bringing the world's attention to the current increase of carbon dioxide in the atmosphere.
The carbon dioxide curve continues marching in an upward direction as shown by the observations of the Mauna Loa Observatory. The Keeling Curve is a graph which plots the ongoing change in concentration of carbon dioxide in Earth's atmosphere since 1958. It is based on continuous measurements taken at the Mauna Loa Observatory in Hawaii under the supervision of Charles David Keeling. Keeling's measurements showed the first significant evidence of rapidly increasing carbon dioxide levels in the atmosphere. Many scientists credit Keeling's graph with first bringing the world's attention to the current increase of carbon dioxide in the atmosphere.
Crédito: Album / Science Source / NOAA
Autorizaciones: ? Cesión de modelo: No - ? Cesión de propiedad: No
¿Preguntas relacionadas con los derechos?
¿Preguntas relacionadas con los derechos?
Tamaño imagen: 3900 × 2511 px | 28.0 MB
Tamaño impresión: 33.0 × 21.3 cm | 1535.4 × 988.6 in (300 dpi)
Palabras clave: 2010 • ÁCIDO CARBÓNICO • AMERICA • AMERICANO • ARTE • ATMOSFERICO • CIENCIA • CLIMA • DIAGRAMA • DIBUJO • ESTADOS UNIDOS DE AMERICA • ESTADOS UNIDOS • GRAFICO • ILUSTRACION • ILUSTRACIONES • METEOROLOGÍA • METEOROLÓGICO • METEREOLOGIA • METEREOLÓGICOS • NIVELES DE, LOS • OBRA DE ARTE • OBSERVATORIO • PLANETARIO • PLANETARIOS • S. XXI • SIGLO XXI
