alb3830544
Tsunami Map, Puerto Rico Earthquake, 1918
| Compartir |
|---|
 Pinterest Pinterest |
 Twitter Twitter |
 Facebook Facebook |
 Copiar enlace Copiar enlace |
 Email Email |
|
Añadir a otro lightbox |
|
Añadir a otro lightbox |


¿Ya tienes cuenta? Iniciar sesión
¿No tienes cuenta? Regístrate
Compra esta imagen.
Selecciona el uso:

Título:
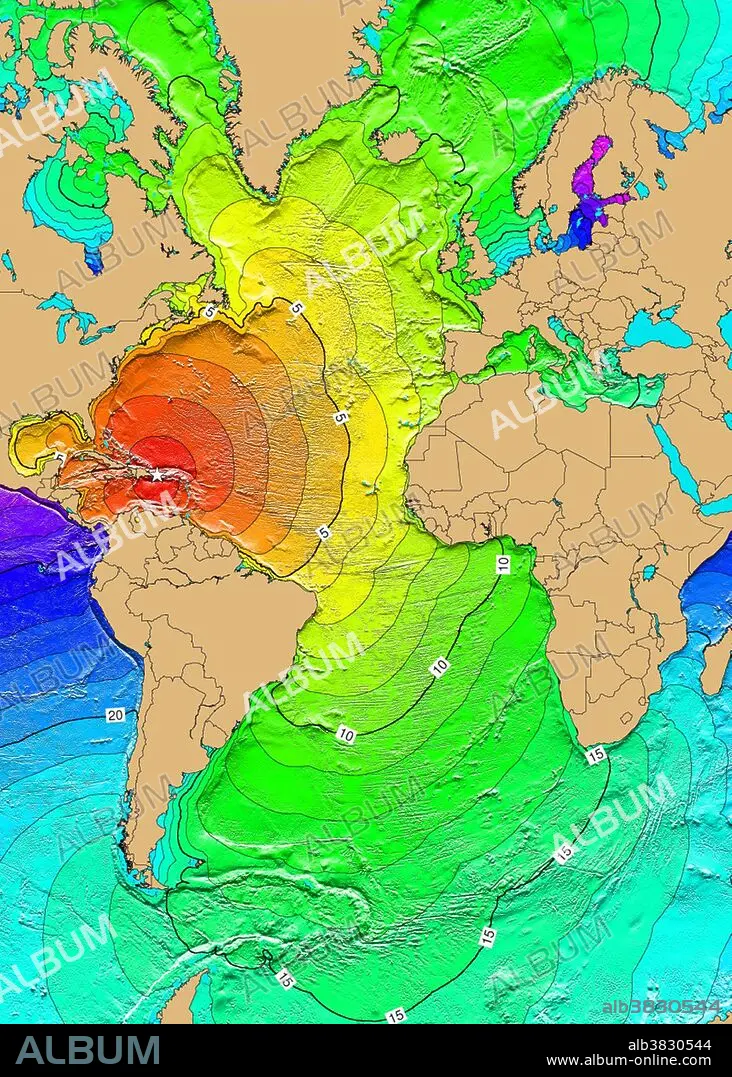
Tsunami Map, Puerto Rico Earthquake, 1918
Descripción:
Ver traducción automática
A magnitude 7.3 Mw earthquake on October 11, 1918, in the Mona Passage, west of Puerto Rico, was caused by displacement along four segments of a normal fault, oriented N-S in the Mona Canyon. The earthquake generated a tsunami with runup heights reaching 6 meters, causing extensive damage along the western and northern coasts of Puerto Rico. The earthquake and tsunami caused $29 million damage, 116 people were killed and 100 were reported missing. Map generated using Tsunami Travel Time (TTT) software: calculates first-arrival travel times on a grid for a tsunami generated at an earthquake epicenter. Map contours: 1 hour intervals: red 1-4 hour arrival times, yellow: 5-6 hour arrival times, green: 7-14 hour arrival times, blue: 15-21 hour arrival times. Maps were generated from earthquake epicenters in the NGDC Global Historical Tsunami Database using NGDC 2 Minute Gridded Global Relief Data bathymetry. Maps do not provide the height or the strength of the wave, only the arrival times.
Crédito:
Album / NOAA/Science Source
Autorizaciones:
Modelo: No - Propiedad: No
¿Preguntas relacionadas con los derechos?
¿Preguntas relacionadas con los derechos?
Tamaño imagen:
3002 x 4200 px | 36.1 MB
Tamaño impresión:
25.4 x 35.6 cm | 10.0 x 14.0 in (300 dpi)
Palabras clave:
1918 • ATLANTICO • CARIBE • CIENCIA DE LA TIERRA • DÉCADA DE 1910 • DESASTRE NATURAL • FAMOSA • FAMOSO • FENÓMENOS • GEOLOGIA • GEOLOGICO • GRAFICO • HIDROGRAFIA • HISTORIA • HISTORICO • IMPORTANTE • MAPA BATIMÉTRICO • MAPA • NOAA • OCEANO ATLANTICO • PUERTO RICO • PUERTORRIQUEÑA • S. XX • SIGLO XX • TECNOLOGÍA • TECNOLÓGICA • TSUNAMI
