alb3839352
Tsunami Map, Unimak Island Earthquake, 1946
| Partager |
|---|
 Pinterest Pinterest |
 Twitter Twitter |
 Facebook Facebook |
 Copier le lien Copier le lien |
 Email Email |
|
Ajouter à une autre Lightbox |
|
Ajouter à une autre Lightbox |


Avez-vous déjà un compte? S'identifier
Vous n'avez pas de compte ? S'inscrire
Acheter cette image

Titre:
Tsunami Map, Unimak Island Earthquake, 1946
Légende:
Voir la traduction automatique
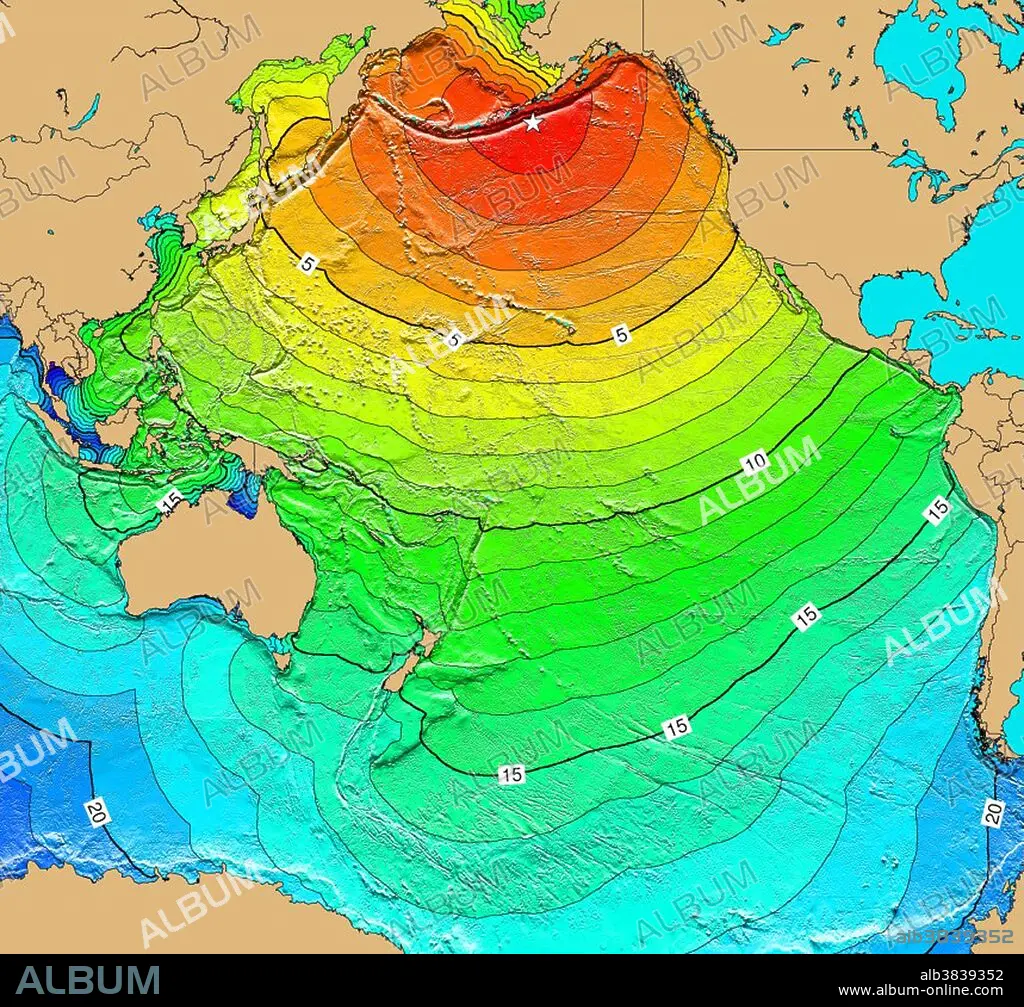
The April 1, 1946 Pacific-wide tsunami was caused by a magnitude 7.3 Ms earthquake that occurred south of Unimak Island, Alaska. Hawaii experienced the worst damage, with 159 deaths (96 at Hilo) and $26 million in property loss. Total property damage in Alaska was $250,000 while California experienced one death and $10,000 damage from the tsunami. These events led to the development of tsunami travel time charts for the Pacific and the Pacific Tsunami Warning Service. Map generated using Tsunami Travel Time (TTT) software: calculates first-arrival travel times on a grid for a tsunami generated at an earthquake epicenter. Map contours: 1 hour intervals: red 1-4 hour arrival times, yellow: 5-6 hour arrival times, green: 7-14 hour arrival times, blue: 15-21 hour arrival times. Maps were generated from earthquake epicenters in the NGDC Global Historical Tsunami Database using NGDC 2 Minute Gridded Global Relief Data bathymetry. Maps do not provide the height or the strength of the wave, only the arrival times.
Crédit:
Album / NOAA/Science Source
Autorisations:
Modèle: Non - Propriété: Non
Questions sur les droits?
Questions sur les droits?
Taille de l'image:
3900 x 3632 px | 40.5 MB
Taille d'impression:
33.0 x 30.8 cm | 13.0 x 12.1 in (300 dpi)
Mots clés:
CARTE • CÉLÈBRE • CELEBRITE • ÉVÉNEMENT • GEOLOGIE • HYDROGRAPHIE • MER • OCEAN • PAYSAGE MARITIME • TECHNOLOGIE • TSUNAMI • XXE SIECLE
