alb9204241
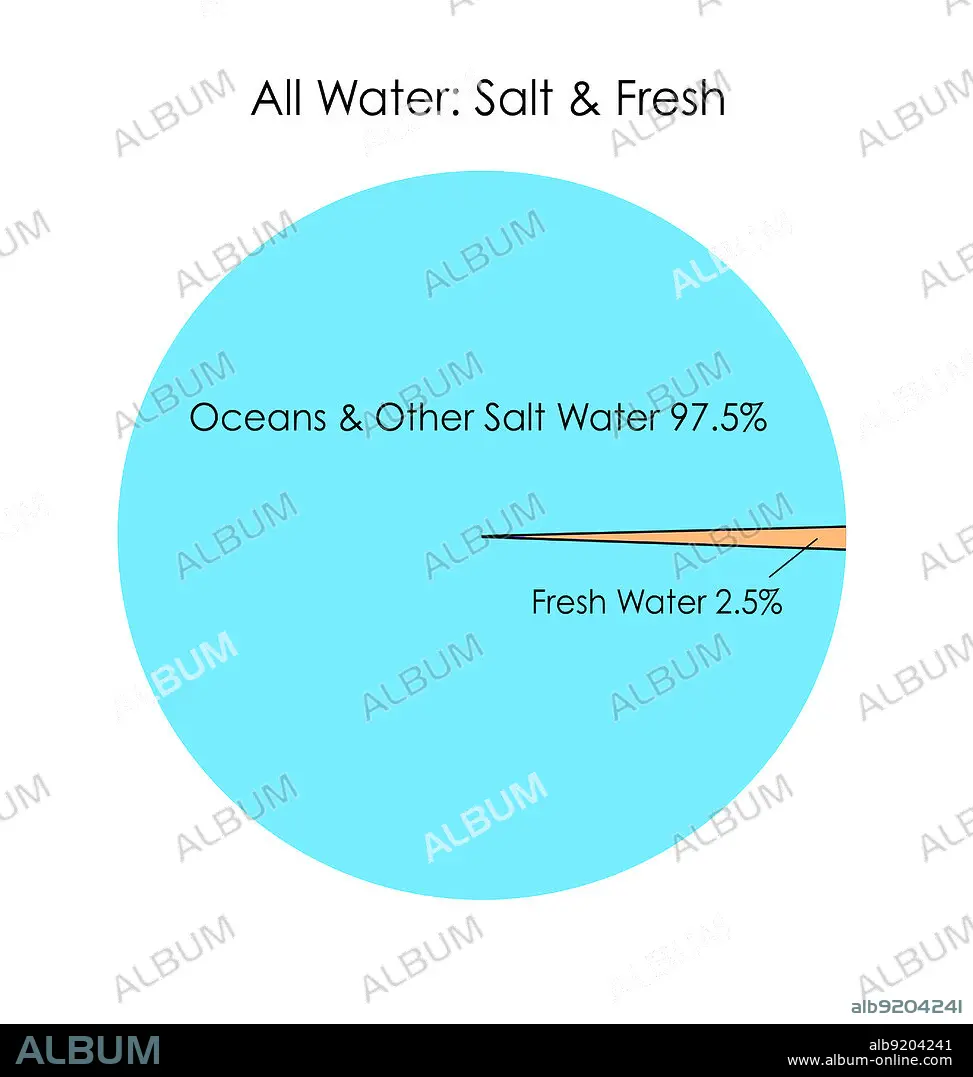
Salt Water vs. Fresh Water, Infographic
| Partager |
|---|
 Pinterest Pinterest |
 Twitter Twitter |
 Facebook Facebook |
 Copier le lien Copier le lien |
 Email Email |
|
Ajouter à une autre Lightbox |
|
Ajouter à une autre Lightbox |


Avez-vous déjà un compte? S'identifier
Vous n'avez pas de compte ? S'inscrire
Acheter cette image.
Sélectionnez l'usage:

Titre: Salt Water vs. Fresh Water, Infographic
Légende: Voir la traduction automatique
A pie chart showing the percentages of salt water and fresh water on Earth. Salt water (oceans and saltwater lakes) accounts for 97.5% of all global water.
A pie chart showing the percentages of salt water and fresh water on Earth. Salt water (oceans and saltwater lakes) accounts for 97.5% of all global water.
Crédit: Album / Jessica Wilson / Science Source
Autorisations: ? Autorisation de modèle: Non - ? Autorisation de propriété: Non
Questions sur les droits?
Questions sur les droits?
Taille de l'image: 4200 × 4418 px | 53.1 MB
Taille d'impression: 35.6 × 37.4 cm | 1653.5 × 1739.4 in (300 dpi)
