alb3830609
Keeling Curve, Carbon Dioxide Scale
| Partager |
|---|
 Pinterest Pinterest |
 Twitter Twitter |
 Facebook Facebook |
 Copier le lien Copier le lien |
 Email Email |
|
Ajouter à une autre Lightbox |
|
Ajouter à une autre Lightbox |


Avez-vous déjà un compte? S'identifier
Vous n'avez pas de compte ? S'inscrire
Acheter cette image.
Sélectionnez l'usage:

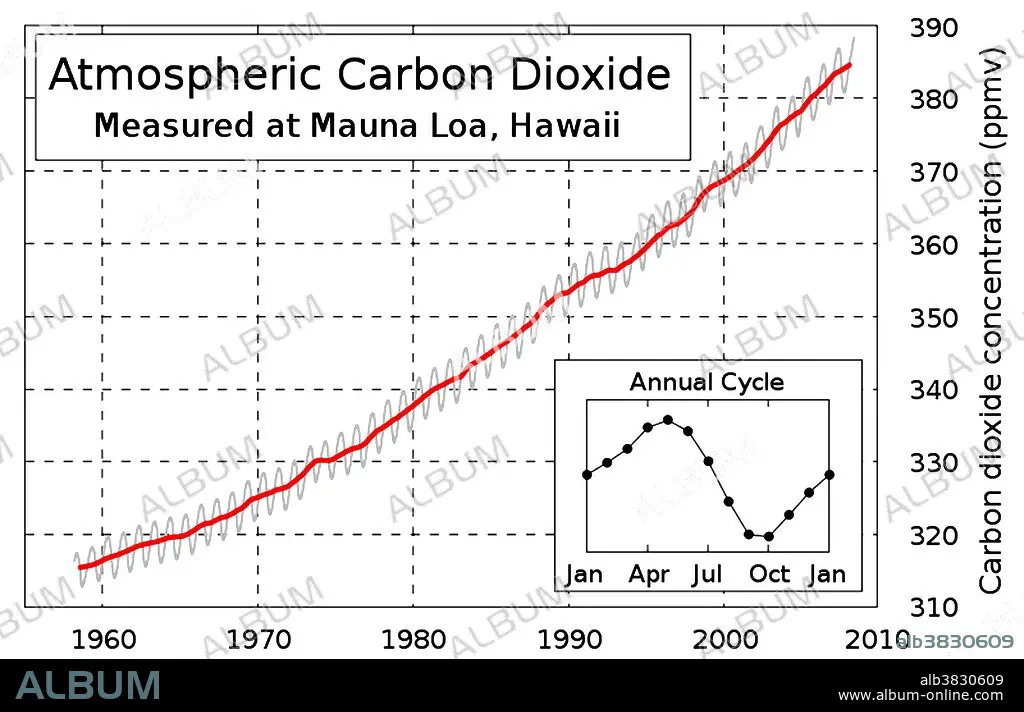
Titre: Keeling Curve, Carbon Dioxide Scale
Légende: Voir la traduction automatique
The carbon dioxide curve continues marching in an upward direction as shown by the observations of the Mauna Loa Observatory. The Keeling Curve is a graph which plots the ongoing change in concentration of carbon dioxide in Earth's atmosphere since 1958. It is based on continuous measurements taken at the Mauna Loa Observatory in Hawaii under the supervision of Charles David Keeling. Keeling's measurements showed the first significant evidence of rapidly increasing carbon dioxide levels in the atmosphere. Many scientists credit Keeling's graph with first bringing the world's attention to the current increase of carbon dioxide in the atmosphere.
The carbon dioxide curve continues marching in an upward direction as shown by the observations of the Mauna Loa Observatory. The Keeling Curve is a graph which plots the ongoing change in concentration of carbon dioxide in Earth's atmosphere since 1958. It is based on continuous measurements taken at the Mauna Loa Observatory in Hawaii under the supervision of Charles David Keeling. Keeling's measurements showed the first significant evidence of rapidly increasing carbon dioxide levels in the atmosphere. Many scientists credit Keeling's graph with first bringing the world's attention to the current increase of carbon dioxide in the atmosphere.
Catégorie: TEMPS (METEOROLOGIE)
Crédit: Album / Science Source / NOAA
Autorisations: ? Autorisation de modèle: Non - ? Autorisation de propriété: Non
Questions sur les droits?
Questions sur les droits?
Taille de l'image: 3900 × 2511 px | 28.0 MB
Taille d'impression: 33.0 × 21.3 cm | 1535.4 × 988.6 in (300 dpi)
Mots clés: 21E SIECLE • ACIDE CARBONIQUE • AMÉRICAIN • CARTE • DIAGRAMME • DIOXIDE DE CARBONE • ILLUSTRATION • METEOROLOGIE • OBSERVATOIRE • PLANETARIUM • TEMPS (METEOROLOGIE) • XXIE SIECLE
