alb9203714
Earth's Water Sources, Infographic
| Partager |
|---|
 Pinterest Pinterest |
 Twitter Twitter |
 Facebook Facebook |
 Copier le lien Copier le lien |
 Email Email |
|
Ajouter à une autre Lightbox |
|
Ajouter à une autre Lightbox |


Avez-vous déjà un compte? S'identifier
Vous n'avez pas de compte ? S'inscrire
Acheter cette image.
Sélectionnez l'usage:

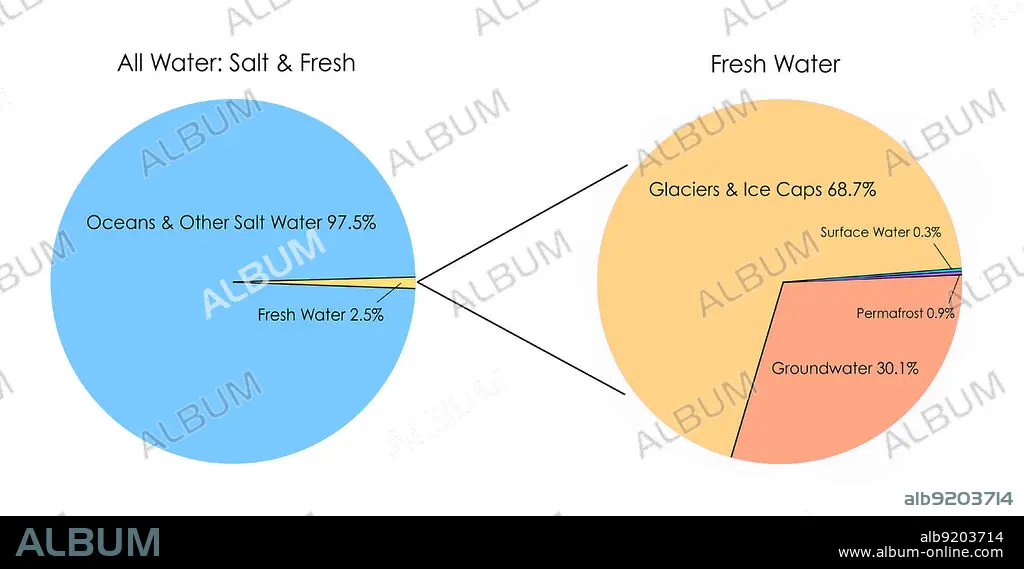
Titre: Earth's Water Sources, Infographic
Légende: Voir la traduction automatique
Two pie charts showing (1) the relative amounts of salt water (97.5%) and fresh water (2.5%) on Earth; and (2) the sources of Earth's 2.5% of fresh water (most of which are frozen and inaccessible). We get most of the water we use from surface water, which comprises only 0.3% of fresh water.
Two pie charts showing (1) the relative amounts of salt water (97.5%) and fresh water (2.5%) on Earth; and (2) the sources of Earth's 2.5% of fresh water (most of which are frozen and inaccessible). We get most of the water we use from surface water, which comprises only 0.3% of fresh water.
Crédit: Album / Jessica Wilson / Science Source
Autorisations: ? Autorisation de modèle: Non - ? Autorisation de propriété: Non
Questions sur les droits?
Questions sur les droits?
Taille de l'image: 5664 × 2856 px | 46.3 MB
Taille d'impression: 48.0 × 24.2 cm | 2229.9 × 1124.4 in (300 dpi)
