alb3830544
Tsunami Map, Puerto Rico Earthquake, 1918
| Partager |
|---|
 Pinterest Pinterest |
 Twitter Twitter |
 Facebook Facebook |
 Copier le lien Copier le lien |
 Email Email |
|
Ajouter à une autre Lightbox |
|
Ajouter à une autre Lightbox |


Avez-vous déjà un compte? S'identifier
Vous n'avez pas de compte ? S'inscrire
Acheter cette image.
Sélectionnez l'usage:

Titre:
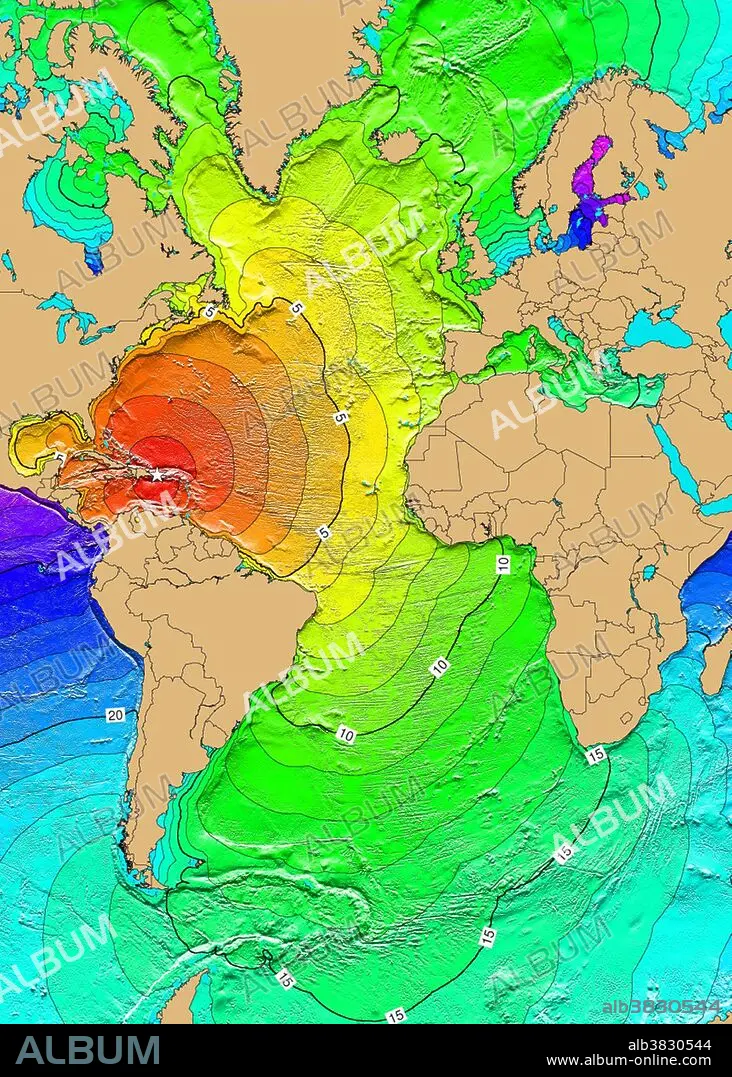
Tsunami Map, Puerto Rico Earthquake, 1918
Légende:
Voir la traduction automatique
A magnitude 7.3 Mw earthquake on October 11, 1918, in the Mona Passage, west of Puerto Rico, was caused by displacement along four segments of a normal fault, oriented N-S in the Mona Canyon. The earthquake generated a tsunami with runup heights reaching 6 meters, causing extensive damage along the western and northern coasts of Puerto Rico. The earthquake and tsunami caused $29 million damage, 116 people were killed and 100 were reported missing. Map generated using Tsunami Travel Time (TTT) software: calculates first-arrival travel times on a grid for a tsunami generated at an earthquake epicenter. Map contours: 1 hour intervals: red 1-4 hour arrival times, yellow: 5-6 hour arrival times, green: 7-14 hour arrival times, blue: 15-21 hour arrival times. Maps were generated from earthquake epicenters in the NGDC Global Historical Tsunami Database using NGDC 2 Minute Gridded Global Relief Data bathymetry. Maps do not provide the height or the strength of the wave, only the arrival times.
Crédit:
Album / NOAA/Science Source
Autorisations:
Modèle: Non - Propriété: Non
Questions sur les droits?
Questions sur les droits?
Taille de l'image:
3002 x 4200 px | 36.1 MB
Taille d'impression:
25.4 x 35.6 cm | 10.0 x 14.0 in (300 dpi)
Mots clés:
ANNEES 1910 • CARAIBE • CARAIBES • CARTE • CÉLÈBRE • CELEBRITE • GEOLOGIE • HYDROGRAPHIE • OCEAN ATLANTIQUE • PORTO RICO • TECHNOLOGIE • TSUNAMI • XXE SIECLE
