alb3828773
Tsunami Map, Krakatoa Eruption, 1883
| Partager |
|---|
 Pinterest Pinterest |
 Twitter Twitter |
 Facebook Facebook |
 Copier le lien Copier le lien |
 Email Email |
|
Ajouter à une autre Lightbox |
|
Ajouter à une autre Lightbox |


Avez-vous déjà un compte? S'identifier
Vous n'avez pas de compte ? S'inscrire
Acheter cette image.
Sélectionnez l'usage:

Titre: Tsunami Map, Krakatoa Eruption, 1883
Légende: Voir la traduction automatique
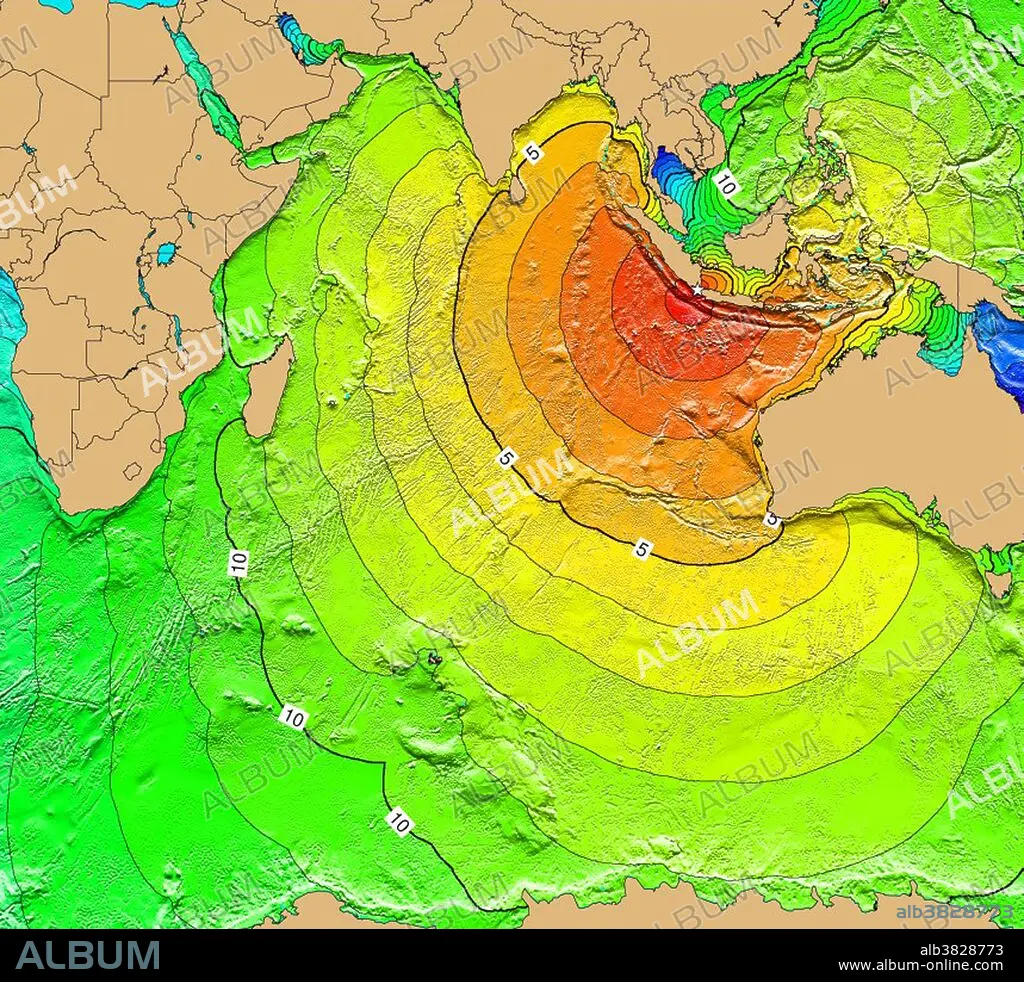
August 27, 1883 Krakatoa. The explosion of the Krakatoa Volcano in Indonesia on August 27, 1883, generated a 30 meter tsunami in the Sunda Strait which killed about 36,000 people. It also caused an atmospheric pressure wave that was recorded on the tide gauges at remote locations including South Georgia Island, Panama, France, England, Alaska, Hawaii, and San Francisco. Due to the shadowing by continents and island groups, a direct tsunami could not have reached most of these locations. Atmospheric gravity waves occurred which may have excited water waves by transferring energy into the ocean. It was recorded with an amplitude of six inches at Sausalito, California. Map generated using Tsunami Travel Time (TTT) software: calculates first-arrival travel times on a grid for a tsunami generated at an earthquake epicenter. Map contours: 1 hour intervals: red 1-4 hour arrival times, yellow: 5-6 hour arrival times, green: 7-14 hour arrival times, blue: 15-21 hour arrival times. Maps were generated from earthquake epicenters in the NGDC Global Historical Tsunami Database using NGDC 2 Minute Gridded Global Relief Data bathymetry. Maps do not provide the height or the strength of the wave, only the arrival times.
August 27, 1883 Krakatoa. The explosion of the Krakatoa Volcano in Indonesia on August 27, 1883, generated a 30 meter tsunami in the Sunda Strait which killed about 36,000 people. It also caused an atmospheric pressure wave that was recorded on the tide gauges at remote locations including South Georgia Island, Panama, France, England, Alaska, Hawaii, and San Francisco. Due to the shadowing by continents and island groups, a direct tsunami could not have reached most of these locations. Atmospheric gravity waves occurred which may have excited water waves by transferring energy into the ocean. It was recorded with an amplitude of six inches at Sausalito, California. Map generated using Tsunami Travel Time (TTT) software: calculates first-arrival travel times on a grid for a tsunami generated at an earthquake epicenter. Map contours: 1 hour intervals: red 1-4 hour arrival times, yellow: 5-6 hour arrival times, green: 7-14 hour arrival times, blue: 15-21 hour arrival times. Maps were generated from earthquake epicenters in the NGDC Global Historical Tsunami Database using NGDC 2 Minute Gridded Global Relief Data bathymetry. Maps do not provide the height or the strength of the wave, only the arrival times.
Personnalités: INDONESIAN
Catégorie: TEMPS (METEOROLOGIE)
Crédit: Album / NOAA/Science Source
Autorisations: ? Autorisation de modèle: Non - ? Autorisation de propriété: Non
Questions sur les droits?
Questions sur les droits?
Taille de l'image: 3970 × 3600 px | 40.9 MB
Taille d'impression: 33.6 × 30.5 cm | 1563.0 × 1417.3 in (300 dpi)
Mots clés: CARTE • CÉLÈBRE • CELEBRITE • ÉVÉNEMENT • GEOLOGIE • HYDROGRAPHIE • INDONESIAN • TECHNOLOGIE • TEMPS (METEOROLOGIE) • TSUNAMI • VOLCAN
